TLDR
Global oil inventories fell 519 million barrels between February and August 2026, a draw of roughly 3 million barrels a day, Citi research found. At that pace, OECD supply cover hits 70 days by end 2027, a threshold last approached during the oil shocks of the 1970s and 1980s.
519 million barrels gone in six months
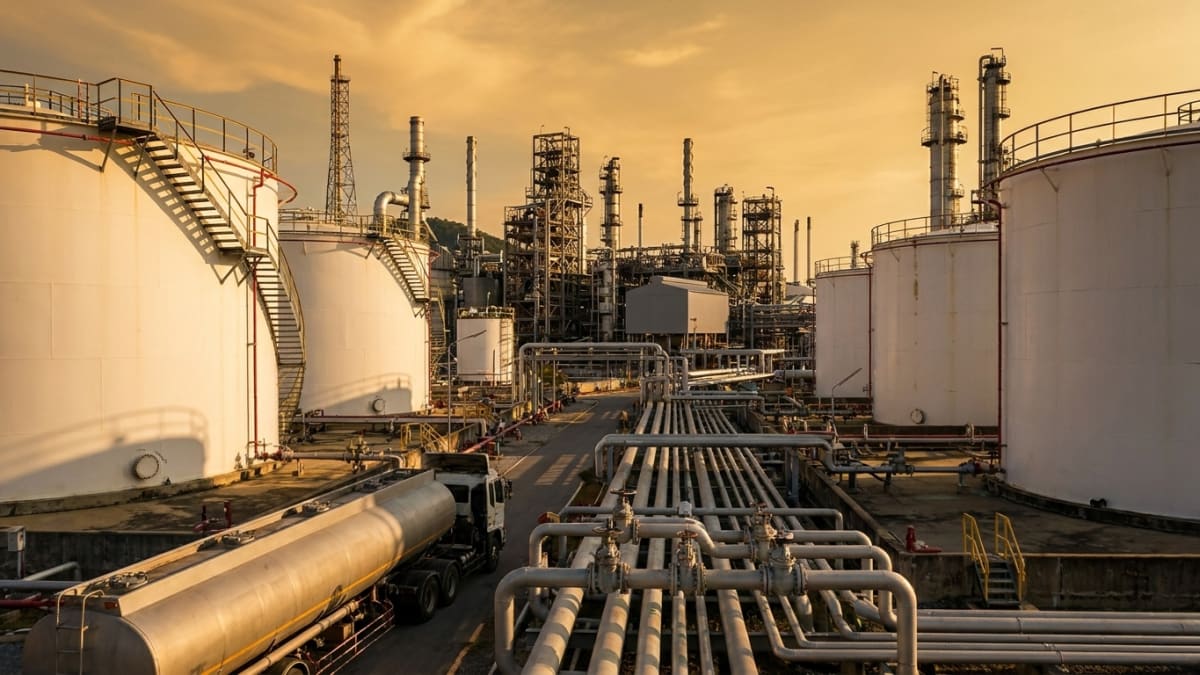
Global observable oil inventories declined by roughly 3 million barrels per day between February and August 2026, totalling a draw of about 519 million barrels across the period, according to Citi research released on 20 August 2026.[1] Six months. Half a billion barrels. Any economy that runs on oil should find that arithmetic uncomfortable, and Australia runs very heavily on it indeed.
Three million barrels a day is roughly equal to the combined daily consumption of Germany, France and the United Kingdom. When that volume is coming not from new production but from existing storage tanks and strategic reserves, the direction of travel matters as much as the destination.
What days-of-cover means, and why 70 matters
Days-of-cover counts how many days of normal consumption current stockpiles can meet before they run dry.[1] In calm markets with healthy inventories, a reading above 90 days is unremarkable. The figure becomes alarming near 70 days, because at that level any meaningful supply disruption, whether a storm, a pipeline failure or a geopolitical flare-up, can trigger the kind of acute price spike that feeds straight into transport costs, power bills and consumer prices.
Seventy days of supply cover was last approached during the major oil shocks of the late 1970s and 1980s, a period most Australians associate with petrol queues and the recession that followed.[1] Citi's modelling puts OECD nations, the bloc of wealthy economies that includes Australia, back at that threshold by end 2027 if drawdowns continue at their current rate. Ex-China global stocks reach the same danger zone by mid-2028, and total global inventories cross into critical territory by the first quarter of 2029.[1]
Those are not predictions of the world running dry. They are estimates of the point at which the buffer available to absorb any shock becomes dangerously thin. Markets do not need inventories to reach zero to price in scarcity; they begin pricing it in well before.
Diesel is already in distress
While the headline inventory figures sketch a trajectory that plays out over years, Citi's analysts were pointed about what is happening right now at the product level. US wholesale diesel prices surged to more than $100 a barrel above the WTI crude benchmark, a spread that signals diesel markets are already under immediate distress.[1] That is not a futures curve quirk or a seasonal blip; it reflects structural tightness in the refined product that keeps trucks moving, mines operating and ships bunkering.
Citi research analysts said: "Specific refined products (especially diesel) are already facing distress now, which could worsen further, meaning more localised, product-specific crises earlier than these projections would suggest."[1] Citi is not describing a risk that might materialise in 2028 or 2029; it is describing a condition that exists today, in the diesel market, with potential to deepen.
For Australia, that is not an abstract concern. Freight logistics, long-haul road transport, agriculture and the mining sector, which underpins a significant share of Australia's export income, all run on diesel at volumes that leave limited room for short-term substitution.[1] A sustained premium in global wholesale diesel prices moves through the supply chain and surfaces in domestic fuel costs, freight rates and ultimately in the price of goods on shelves.
The Hormuz variable
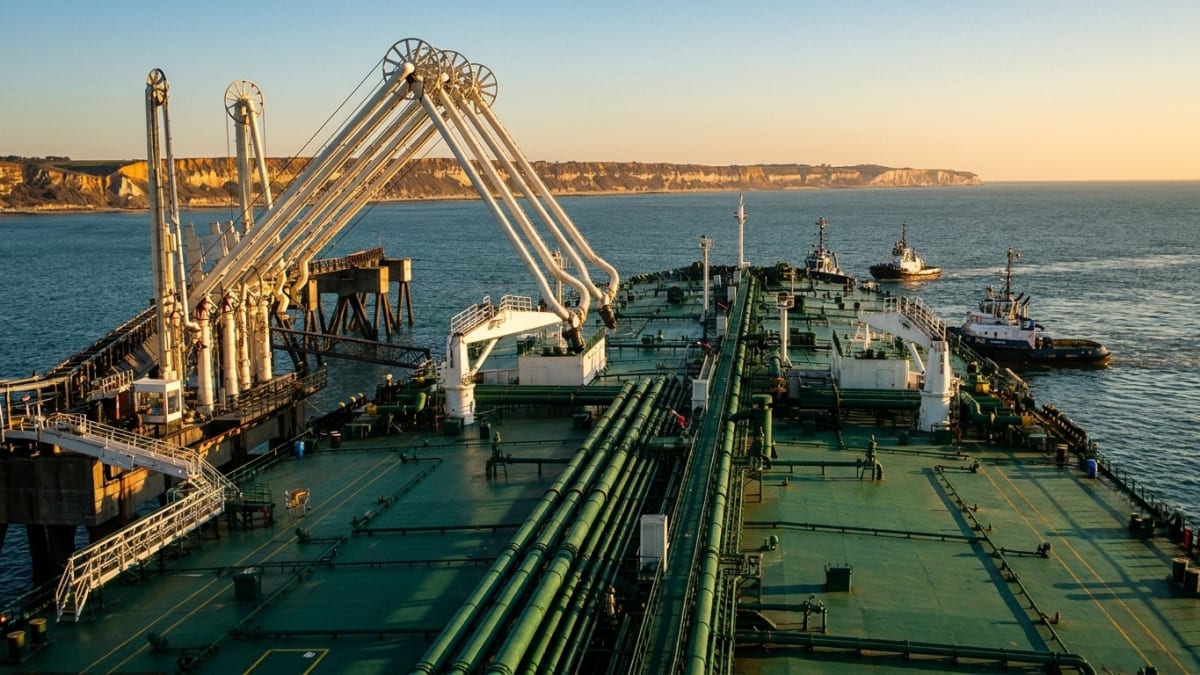
Much of the current inventory draw traces to reduced crude flows through the Strait of Hormuz, the narrow waterway through which roughly a fifth of the world's seaborne oil passes. Disruptions there, whether from geopolitical tension, shipping constraints or outright closure risk, have tightened the supply side of the equation even as demand has stayed firm.
Citi's base case is that the situation does not persist indefinitely. Analysts said: "Citi's base case still assumes a deal and reopening in the fourth quarter, with Brent returning to the $60s in 2027."[1] A diplomatic breakthrough that restores normal Hormuz traffic in the fourth quarter of 2026 would, on Citi's modelling, allow inventories to stabilise and prices to moderate.
The base case carries the uncertainty that all base cases do. A fourth-quarter deal is an assumption, not a confirmed outcome. If Hormuz restrictions persist into 2027 or beyond, the drawdown trajectory accelerates and the timelines for OECD and global inventories hitting critical cover levels compress accordingly.
Australia's specific exposure
Australia's exposure to global oil inventory dynamics is shaped by a structural fact policymakers have acknowledged for years: Australia holds among the lowest strategic fuel reserves of any International Energy Agency member, measured in days of net import cover. The country is a price-taker in global oil markets, with no meaningful capacity to influence either the supply or the benchmark price of the crude it imports.
When global diesel markets tighten, as they have, with US wholesale prices running more than $100 above WTI, the signal travels directly to the Australian wholesale fuel market through the import-parity pricing mechanism. Mining companies with large diesel consumption have hedging programmes that provide some insulation, but those hedges have finite durations. Freight operators and small-to-medium businesses typically do not hedge at all.
Citi's research does not name Australia specifically. The mechanics are straightforward, though: an economy that imports the bulk of its refined transport fuel, holds limited strategic reserves, and whose two largest export earners, iron ore and coal, are extracted and moved using diesel at scale, sits squarely in the exposure zone that a 519-million-barrel inventory draw and a $100-a-barrel diesel premium describe.[1]
Citi's modelling carries one important caveat worth stating plainly. The research draws on observable inventories, stocks measurable through satellite data, port reports and official national statistics. Not all global oil storage is observable. Some volumes held in strategic reserves, in transit or in less transparent jurisdictions do not appear in these figures. The actual global cushion may be marginally larger than the observable numbers suggest, or marginally smaller, if some reported reserves have already been drawn down in ways that have not yet appeared in public data. Neither possibility changes the direction of the trend; it adjusts the timeline.
On Citi's numbers, if the world continues drawing down its stockpile buffer at 3 million barrels a day, the OECD reaches the critical 70-day supply cover threshold by the end of 2027, roughly 16 months away.
KEY TAKEAWAYS
SOURCES & CITATIONS
FREQUENTLY ASKED QUESTIONS