

TLDR
Gold hit a record US$5,405 per ounce in January 2026 before crashing below US$4,000 on 24 June, its lowest level since November 2025, then recovering to around US$4,100 by mid-July. Central banks averaged 1,000 tonnes of gold purchases a year over the past four years, double the pace of the prior decade, and show no sign of slowing. A record 45% of reserve managers surveyed by the World Gold Council plan to add more gold in the next 12 months, signalling the correction is being read as an opportunity rather than a warning. Gold has now overtaken US Treasuries as the world's top official reserve asset, holding a 27% share of global reserves versus 22% for Treasuries.
KEY TAKEAWAYS
From January record to a June floor
The LBMA gold price reached a historical high of US$5,405 per ounce in January 2026verifiedVerified Source: gold.org, capping a multi-year rally that rewrote the calculus for central bank reserve managers, sovereign wealth funds and retail buyers alike.[2] Gold became the standout financial asset of the post-pandemic era, cementing its place in official portfolios well beyond what even its strongest advocates had forecast two years prior.
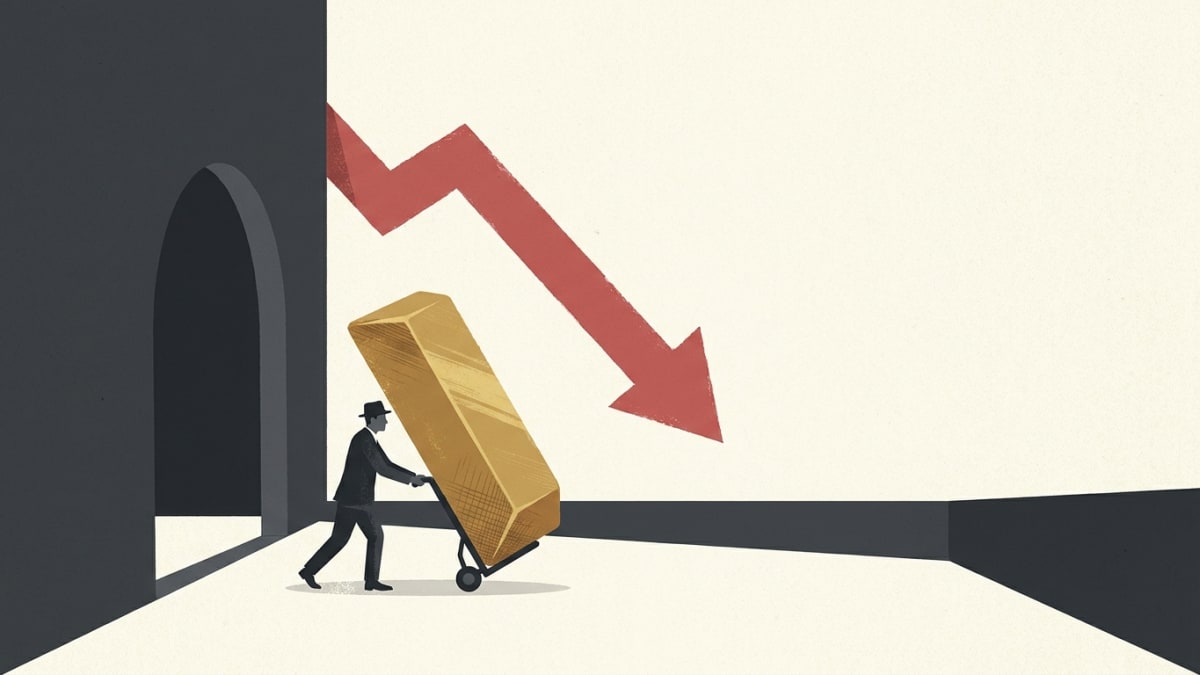
Then came the reversal. Spot gold closed at US$3,994.19 per ounce on 24 June 2026, dipping below US$4,000 for the first time since November 2025verifiedVerified Source: mygoldcalc.com.[3] The drawdown from the January peak to the June trough exceeded 26%, sharp enough to shake retail positioning but, as the survey data now shows, not sharp enough to move sovereign buyers off their strategy.
Recovery came quickly: by mid-July 2026 gold traded between US$4,042.31 and US$4,181.41 an ounce, closing at US$4,108.44 on 11 July.[6] The bounce suggested that whatever triggered the June sell-off, it did not dislodge the structural buying that had underpinned gold's multi-year run.
Why central banks kept buying through the sell-off
Central banks have accumulated an average of 1,000 tonnes of gold per year over the past four years, up from an average of 500 tonnes per year over the preceding decadeverifiedVerified Source: gold.org, according to the World Gold Council's 2026 Central Bank Gold Reserves Survey.[1] That doubling of the purchase rate tracks almost precisely with the period of elevated geopolitical tension, US sanctions activity and sustained US dollar debate that followed Russia's invasion of Ukraine in 2022.
Shaokai Fan, Global Head of Central Banks and Head of Asia-Pacific (ex-China) at the World Gold Council, said the 2026 survey results carried an unambiguous message. "This year's survey sends a clear message: central bank demand for gold remains on an upward trajectory. A record number of respondents plan to add gold to their own reserves in the next year, while a large majority expect global official sector holdings to keep rising. What stands out is the shift in how central banks think about gold. Fewer see it as a legacy holding; more see it as an active, strategic allocation in an environment defined by geopolitical uncertainty and reserve diversification."[4] That framing points to a deliberate reweighting of sovereign balance sheets rather than opportunistic price-chasing.
A record 45% of central bank reserve managers surveyed said they expect to increase their own institutions' gold holdings over the next 12 months.[4] The survey was published on 16 June 2026, eight days before the price broke below US$4,000, so the buying intentions preceded the correction and were not a reaction to cheaper prices.
The dollar-to-gold shift in reserve strategy
The most structurally significant data point in the 2026 cycle sits in the reserve composition figures. Gold accounted for 27% of total official global reserves at end-2025, overtaking US Treasuries, which held a 22% share, according to UBS citing World Gold Council data.[5] For most of the post-Bretton Woods era, US Treasuries sat uncontested at the top of the reserve hierarchy; the inversion of that relationship is a generational shift in sovereign finance.
David Gornall, former Chair of the London Bullion Market Association, has said gold plays a critical role in reserve diversification, pointing to its liquidity and universal acceptability across counterparties that may be unwilling to transact in US dollars.[7] That characteristic, convertibility without counterparty credit risk, is precisely what makes gold attractive to reserve managers navigating a world of sanctions, secondary restrictions and currency fragmentation.
The shift also reflects anxiety about dollar dominance. Emerging-market central banks have led the buying, but the World Gold Council survey data shows accumulation intentions are now widespread across institution types and geographies, not confined to a bloc of dollar-sceptic sovereigns.
What the correction means for retail investors and ASX miners
The Q2 2026 correction, from January peaks near US$5,400 to below US$4,000 in late June, created a bifurcated landscape for non-sovereign gold participants. Retail investors who entered after the January record faced mark-to-market losses of more than a quarter in six months. For those with longer time horizons and lower entry points, the June floor represented a potential accumulation zone backed by the same structural demand story that drove prices to record levels.
ASX-listed gold miners faced a more complex set of variables. Elevated gold prices earlier in the year generated strong revenue assumptions in forward contracts and project financing; the subsequent drop compressed margins for producers operating at the higher end of the all-in sustaining cost curve. Input cost pressures, diesel, labour and reagents, did not fall in proportion to the gold price, squeezing producers whose cost structures were calibrated for a price above US$4,500 per ounce.
Hedging strategies became a point of differentiation. Miners that locked in prices closer to the January highs were partially insulated from the June sell-off, while unhedged producers absorbed the full swing. The mid-July recovery toward US$4,108 per ounce provided some relief, but the trading range of US$4,042 to US$4,181 recorded in that period still sat roughly 23% below the January record.[6]
Australia's stake in a volatile gold market
Australia is the world's second-largest gold producer, a position that makes the country's mining sector acutely sensitive to price swings of the magnitude seen in the first half of 2026. Export revenues from gold, already elevated by the multi-year price rally, are recalibrating as the spot price consolidates in the US$4,000 to US$4,200 range. The Australian dollar's movements against the US dollar add a further layer of complexity, given that gold is priced internationally in US dollars but miners' costs are predominantly denominated in Australian dollars.
The exploration sector faces a different calculus. Junior explorers and development-stage companies that raised capital at equity valuations tied to a US$5,000-plus gold price may find project economics tighter at current levels, particularly for higher-cost deposits. Established producers with low-cost operations and strong balance sheets are better placed to weather the correction and potentially use it to acquire assets at prices that reflect the June floor rather than the January peak.
The same survey points to sustained demand from the sovereign buyers who have been the marginal force in the gold market for the past four years.[1]
SOURCES & CITATIONS
- World Gold Council: Central Bank Gold Reserves Survey 2026
- World Gold Council: Gold Demand Trends Q1 2026
- MyGoldCalc: Gold Price 24 June 2026
- World Gold Council: Central Banks Survey Press Release 2026
- UBS Chief Investment Office: House View Daily 3 June 2026
- MyGoldCalc: Gold Price July 2026
- LBMA: Precious Metals Market Report Q1 2026
FREQUENTLY ASKED QUESTIONS
Why did gold fall below US$4,000 in June 2026?
Are central banks still buying gold despite the price drop?
Has gold overtaken US Treasuries as the top reserve asset?
What does the gold price correction mean for Australian miners?
Simon Wu writes about Asia-Pacific markets and China's economy. He reads the Chinese-language financial press closely and looks for the stories that reach Australia before anyone here notices.